Definition of an Investigation
“Students at all grade levels and in every domain of science should have the opportunity to use scientific inquiry and develop the ability to think and act in ways associated with inquiry, including asking questions,planning and conducting investigations, using appropriate tools and techniques to gather data, thinking critically and logically about relationships between evidence and explanations, constructing and analyzing alternative explanations, and communicating scientific arguments” (NRC 1996)
“At its heart, inquiry is an active learning process in which students answer research questions through data analysis.” (Bell 2005)
“Students are doing inquiry when they:
“At its heart, inquiry is an active learning process in which students answer research questions through data analysis.” (Bell 2005)
“Students are doing inquiry when they:
- Are engaged with scientifically oriented questions;
- Give priority to evidence;
- Formulate evidence-based explanations;
- Compare and evaluate the merit of explanations; and
- Communicate and justify explanations.” (NRC 2000).
Definition of a Benchmark lesson
“ […] (1) exploration, (2) concept invention, and (3) application […] The purpose of the exploration phase is to get students ready to learn new concepts through activities designed to raise student interest and identify levels of prior knowledge […] The concept invention phase builds on the exploration phase and involves information input, usually from the teacher or a text […] In the application phase, the teacher uses strategies that require students to apply the newly constructed concepts to novel problems and situations.” (Gillis 2007)
Week 1 Day 2: Poker Investigation
Overview
Time: One 50-minute lesson
The instructor will lead a guided inquiry (level 3) focused on the definitions of permutation and combination utilizing a deck of cards. The question provided will be “How many groups of 5 can you create?” Each team will be given a deck of cards and a handout (see pokertable.pdf) of a table with different tasks for creating groups of 5 from 5 cards, 7 cards, 13 cards, and 52 cards. The instructor will walk around as students attempt to write down all of the groups and take note of the methods they are using. A possible question that may come up is “Does the order of the cards matter?” or something of-the-like. This is a great opportunity for the instructor to bring the class together and have a discussion on if order matters. For example, “Is ‘23456’ the same hand as ‘25436’”? The class will create t-chart on the board of situations when order matters and when order does not matter (ex: a combination lock, phone number, …).Then the instructor will write above ‘order matters,’ ‘permutation’ and above ‘order does not matter,’ ‘combination’ and ask students to write this t-chart on the back of their handout. Students will continue to fill out the handout now with instructions to find the permutation of the 1st and 3rd rows of the table and combinations of the 2nd and 4th rows of the table. After 10 to 15 minutes the class will come together and share what each group did. Did they find an easier way than listing out all of the combinations? The instructor can demonstrate the tree diagram on the board as an example of another method and then the equations.
Objectives
Students will be able to:
Alignment with Texas Essential Knowledge and Skills (TEKS)
Geometry TEKS
(13) Probability. The student uses the process skills to understand probability in real-world situations and how to apply independence and dependence of events. The student is expected to:
Time: One 50-minute lesson
The instructor will lead a guided inquiry (level 3) focused on the definitions of permutation and combination utilizing a deck of cards. The question provided will be “How many groups of 5 can you create?” Each team will be given a deck of cards and a handout (see pokertable.pdf) of a table with different tasks for creating groups of 5 from 5 cards, 7 cards, 13 cards, and 52 cards. The instructor will walk around as students attempt to write down all of the groups and take note of the methods they are using. A possible question that may come up is “Does the order of the cards matter?” or something of-the-like. This is a great opportunity for the instructor to bring the class together and have a discussion on if order matters. For example, “Is ‘23456’ the same hand as ‘25436’”? The class will create t-chart on the board of situations when order matters and when order does not matter (ex: a combination lock, phone number, …).Then the instructor will write above ‘order matters,’ ‘permutation’ and above ‘order does not matter,’ ‘combination’ and ask students to write this t-chart on the back of their handout. Students will continue to fill out the handout now with instructions to find the permutation of the 1st and 3rd rows of the table and combinations of the 2nd and 4th rows of the table. After 10 to 15 minutes the class will come together and share what each group did. Did they find an easier way than listing out all of the combinations? The instructor can demonstrate the tree diagram on the board as an example of another method and then the equations.
Objectives
Students will be able to:
- Distinguish between permutation and combinations
Alignment with Texas Essential Knowledge and Skills (TEKS)
Geometry TEKS
(13) Probability. The student uses the process skills to understand probability in real-world situations and how to apply independence and dependence of events. The student is expected to:
- (A) develop strategies to use permutations and combinations to solve contextual problems;
| pokertable.pdf |
Week 1 Day 3: Independence Benchmark
Overview
Time: One 30-minute lessons
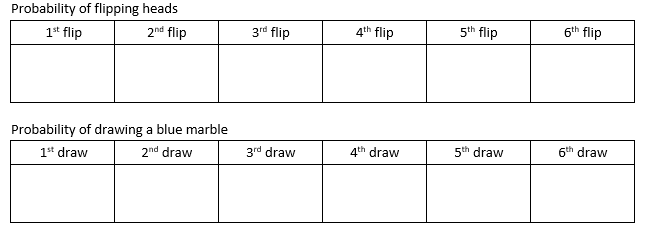
The instructor will lead an interactive lecture focused on the concept of independence. To begin the instructor will have one quarter under the doc cam and ask “What is the probability of flipping heads?” The instructor will call on different students to answer what is the probability at each flip and fill in this table on a handout under the doc cam. The probabilities should be 0.5 across the row. Then the instructor will take out 6 marbles in a cup, 3 blue and 3 red, and do the same thing, but after each draw the instructor will not put the marble back in the cup. The probabilities will be different across the row. The instructor will ask “What is the difference between the two tables?”
Time: One 30-minute lessons
The instructor will lead an interactive lecture focused on the concept of independence. To begin the instructor will have one quarter under the doc cam and ask “What is the probability of flipping heads?” The instructor will call on different students to answer what is the probability at each flip and fill in this table on a handout under the doc cam. The probabilities should be 0.5 across the row. Then the instructor will take out 6 marbles in a cup, 3 blue and 3 red, and do the same thing, but after each draw the instructor will not put the marble back in the cup. The probabilities will be different across the row. The instructor will ask “What is the difference between the two tables?”
The instructor will then introduce the concept of independence and ask the class “Which situation was independent from each other and which was not?” and have one student explain why. Then the instructor will do a “rapid fire” questioning activity where students will shout out ‘independent’ or ‘dependent’ to these situations:
Objectives
Students will be able to:
Alignment with Texas Essential Knowledge and Skills (TEKS)
Geometry TEKS
(13) Probability. The student uses the process skills to understand probability in real-world situations and how to apply independence and dependence of events. The student is expected to:
- The probability of having a girl after having 3 boys
- The probability of rolling a 3 the first time and the probability of rolling a 6 the second time
- The probability of spinning a red the first time and the probability of spinning a green the second time
Objectives
Students will be able to:
- Determine whether an event is independent or not
- Calculate the probability of an event
Alignment with Texas Essential Knowledge and Skills (TEKS)
Geometry TEKS
(13) Probability. The student uses the process skills to understand probability in real-world situations and how to apply independence and dependence of events. The student is expected to:
- (C) identify whether two events are independent and compute the probability of the two events occurring together with or without replacement;
- (D) apply conditional probability in contextual problems; and
- (E) apply independence in contextual problems.
Week 1 Day 4: Liar's Dice Investigation
Overview
Time: 50 min
This will be a guided inquiry (level 3) focused on the probability of an event with or without replacement. Students will play a simpler version of Liar’s Dice and calculate the probability of each call. The rules of the game should have already been taught previously, but the instructor may do a quick overview. The instructor will explain the instructions of the activity and model one example of calculating the probability of a 'call' during the game. Each person should have a handout (see liarsdice.pdf) and 3 dice. Players will play the game within their team and fill out the handout as the game progresses. At the end of the time the instructor will bring the class together and asked what they noticed about the probabilities.
Objectives
Students will be able to:
Alignment with Texas Essential Knowledge and Skills (TEKS)
Geometry TEKS
(13) Probability. The student uses the process skills to understand probability in real-world situations and how to apply independence and dependence of events. The student is expected to:
Time: 50 min
This will be a guided inquiry (level 3) focused on the probability of an event with or without replacement. Students will play a simpler version of Liar’s Dice and calculate the probability of each call. The rules of the game should have already been taught previously, but the instructor may do a quick overview. The instructor will explain the instructions of the activity and model one example of calculating the probability of a 'call' during the game. Each person should have a handout (see liarsdice.pdf) and 3 dice. Players will play the game within their team and fill out the handout as the game progresses. At the end of the time the instructor will bring the class together and asked what they noticed about the probabilities.
Objectives
Students will be able to:
- Calculate the probability of an event
- Determine whether an event is independent or not
- Calculate the probability of an event with replacement and an event without replacement
Alignment with Texas Essential Knowledge and Skills (TEKS)
Geometry TEKS
(13) Probability. The student uses the process skills to understand probability in real-world situations and how to apply independence and dependence of events. The student is expected to:
- (C) identify whether two events are independent and compute the probability of the two events occurring together with or without replacement;
- (D) apply conditional probability in contextual problems; and
- (E) apply independence in contextual problems.
| liarsdice.pdf |
Week 1 Day 5: Work Day
Time: One 50-minute class day
During this day, Milestone 1 will be due at the beginning of the class period. Students will use the first half of the class to peer review each other's work on the week's milestone and then use the second half of the class to begin work on next week's milestone that is due.
During this day, Milestone 1 will be due at the beginning of the class period. Students will use the first half of the class to peer review each other's work on the week's milestone and then use the second half of the class to begin work on next week's milestone that is due.
| milestoneone.pdf |
Week 2 Day 1: Deal or No Deal Benchmark
Overview
Time: One 50-minute lesson
During this lesson, the students will calculate the probability of a given event, analyze the risk/reward, and conjecture reasonable decisions based on evidence through the learning cycle approach. Deal or No Deal will need to be purchased or constructed by the teacher. For example, lunchboxes may be used as the suitcases with numbered sticky notes or the game can be purchased at a nearby retail store .
The teacher will introduce the game to the students and give the general rules and objective of Deal or No Deal. Beginning the game, one briefcase will be chosen for the class by randomly picking one student. Then, use the same random style of picking for choosing a student who will decide which briefcase to open for each time one is needed. Once a round of suitcases is over, the teacher will “receive a call” from the Bank who will offer a given amount of money based on the suitcases left. The amount that is determined by the Bank can be calculated via the provided excel sheet (see dealornodeal.xlsx).
During the game, the students will be completing a graphic organizer similar to this table (see dealornodealtable.pdf):
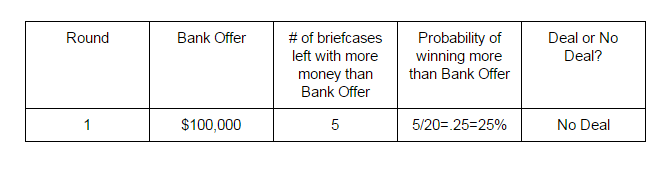
A portion of the table should be answered after round is completed. Here, the students will calculate the probability of winning more than the bank offer and then discuss with their peers of weighing the decisions of taking the Bank's offer (Deal) or rejecting the offer (No Deal). The students should vote for their decision anonymously via a poll created by the teacher (polls can be created for free at https://www.polleverywhere.com). The majority rule wins and the game will continue if the offer is rejected, or the game will end if the offer is accepted.
Objectives
Students will be able to:
Alignment with Texas Essential Knowledge and Skills (TEKS)
Geometry TEKS
(1) Mathematical process standards. The student uses mathematical processes to acquire and demonstrate mathematical understanding. The student is expected to:
Advanced Quantitative Reasoning TEKS
(4) Probabilistic and statistical reasoning. The student uses the process standards in mathematics to generate new understandings of probability and statistics. The student analyzes statistical information and evaluates risk and return to connect mathematical ideas and make informed decisions. The student applies a problem-solving model and statistical methods to design and conduct a study that addresses one or more particular question(s). The student uses multiple representations to communicate effectively the results of student-generated statistical studies and the critical analysis of published statistical studies. The student is expected to:
Objectives
Students will be able to:
- Apply independence in contextual problems to calculate the probability of a given event
- Use probabilities to justify decisions about risk
- Calculate expected value analyze mathematical fairness, risk, and payoff
- Communicate arguments using precise mathematical language via oral communication or written communication
Alignment with Texas Essential Knowledge and Skills (TEKS)
Geometry TEKS
(1) Mathematical process standards. The student uses mathematical processes to acquire and demonstrate mathematical understanding. The student is expected to:
- (A) apply mathematics to problems arising in everyday life, society, and the workplace;
- (B) use a problem-solving model that incorporates analyzing given information, formulating a plan or strategy, determining a solution, justifying the solution, and evaluating the problem-solving process and the reasonableness of the solution;
- (C) select tools, including real objects, manipulatives, paper and pencil, and technology as appropriate, and techniques, including mental math, estimation, and number sense as appropriate, to solve problems;
- (D) communicate mathematical ideas, reasoning, and their implications using multiple representations, including symbols, diagrams, graphs, and language as appropriate;
- (E) create and use representations to organize, record, and communicate mathematical ideas;
- (F) analyze mathematical relationships to connect and communicate mathematical ideas; and
- (G) display, explain, and justify mathematical ideas and arguments using precise mathematical language in written or oral communication.
- (E) apply independence in contextual problems.
Advanced Quantitative Reasoning TEKS
(4) Probabilistic and statistical reasoning. The student uses the process standards in mathematics to generate new understandings of probability and statistics. The student analyzes statistical information and evaluates risk and return to connect mathematical ideas and make informed decisions. The student applies a problem-solving model and statistical methods to design and conduct a study that addresses one or more particular question(s). The student uses multiple representations to communicate effectively the results of student-generated statistical studies and the critical analysis of published statistical studies. The student is expected to:
- (E) use probabilities to make and justify decisions about risks in everyday life;
- (F) calculate expected value to analyze mathematical fairness, payoff, and risk;
| dealornodeal.xlsx |
| dealornodealtable.pdf |
Week 2 Day 2: Spinner Wheel Investigation
Overview
Time: One 50-minute Lesson
During this lesson, the students will learn about calculating expected value and probability based on area. The teacher will begin the lesson with a few discussion questions such as: “Does the amount of area in a section of your game board affect the probability of landing on that section?”, “For any given dartboard, why are there certain sections of the same size and some sections are different?”, “How about on the Wheel of Fortune from television? Most of the sections of the wheel are the same size except for a few?”
The teacher will pass out a set of handouts (see spinnerhandout.pdf) and spinners for each group where 1 spinner has 4 sections of all equal area and 1 spinner has 4 sections of all unequal area. The teacher will then present the students guiding questions which revolve around, “How does area affect probability?”. The students will then answer a few questions from their handout which hypothesize how area will affect probability. The students will then collect data by their spinners and record their results. At this point, the teacher will be driving students to formulate a calculation which will yield the probability of each section. For example, most students will answer that from the spinner with 4 equal sections the probability for each section is 25%. But why is that?
By driving the students to the premise that area directly affects probability of a given event, ask students to calculate the areas of each section and the whole, and compare the areas and written data.
The teacher will conclude with a discussion of how this concept will affect the design and probability of their games.
Because the driving question and methods are teacher-generated, but the answer to the question is student-generated, this inquiry counts as Level 2 Inquiry.
Objectives
Students will be able to:
Alignment with Texas Essential Knowledge and Skills (TEKS)
Geometry TEKS
(1) Mathematical process standards. The student uses mathematical processes to acquire and demonstrate mathematical understanding. The student is expected to:
(12) Circles. The student uses the process skills to understand geometric relationships and apply theorems and equations about circles. The student is expected to:
(13) Probability. The student uses the process skills to understand probability in real-world situations and how to apply independence and dependence of events. The student is expected to:
Time: One 50-minute Lesson
During this lesson, the students will learn about calculating expected value and probability based on area. The teacher will begin the lesson with a few discussion questions such as: “Does the amount of area in a section of your game board affect the probability of landing on that section?”, “For any given dartboard, why are there certain sections of the same size and some sections are different?”, “How about on the Wheel of Fortune from television? Most of the sections of the wheel are the same size except for a few?”
The teacher will pass out a set of handouts (see spinnerhandout.pdf) and spinners for each group where 1 spinner has 4 sections of all equal area and 1 spinner has 4 sections of all unequal area. The teacher will then present the students guiding questions which revolve around, “How does area affect probability?”. The students will then answer a few questions from their handout which hypothesize how area will affect probability. The students will then collect data by their spinners and record their results. At this point, the teacher will be driving students to formulate a calculation which will yield the probability of each section. For example, most students will answer that from the spinner with 4 equal sections the probability for each section is 25%. But why is that?
By driving the students to the premise that area directly affects probability of a given event, ask students to calculate the areas of each section and the whole, and compare the areas and written data.
The teacher will conclude with a discussion of how this concept will affect the design and probability of their games.
Because the driving question and methods are teacher-generated, but the answer to the question is student-generated, this inquiry counts as Level 2 Inquiry.
Objectives
Students will be able to:
- Calculate probability based on area
- Apply the proportional relationship between the measure of the area of a sector of a circle and the area of a circle to solve problems
- Apply independence in contextual problems to calculate probability of a given event
- Justify the mathematical concept of probability based on area with evidence
Alignment with Texas Essential Knowledge and Skills (TEKS)
Geometry TEKS
(1) Mathematical process standards. The student uses mathematical processes to acquire and demonstrate mathematical understanding. The student is expected to:
- (A) apply mathematics to problems arising in everyday life, society, and the workplace;
- (B) use a problem-solving model that incorporates analyzing given information, formulating a plan or strategy, determining a solution, justifying the solution, and evaluating the problem-solving process and the reasonableness of the solution;
- (C) select tools, including real objects, manipulatives, paper and pencil, and technology as appropriate, and techniques, including mental math, estimation, and number sense as appropriate, to solve problems;
- (D) communicate mathematical ideas, reasoning, and their implications using multiple representations, including symbols, diagrams, graphs, and language as appropriate;
- (E) create and use representations to organize, record, and communicate mathematical ideas;
- (F) analyze mathematical relationships to connect and communicate mathematical ideas; and
- (G) display, explain, and justify mathematical ideas and arguments using precise mathematical language in written or oral communication.
(12) Circles. The student uses the process skills to understand geometric relationships and apply theorems and equations about circles. The student is expected to:
- (C) apply the proportional relationship between the measure of the area of a sector of a circle and the area of the circle to solve problems;
(13) Probability. The student uses the process skills to understand probability in real-world situations and how to apply independence and dependence of events. The student is expected to:
- (B) determine probabilities based on area to solve contextual problems;
- (E) apply independence in contextual problems.
| spinnerhandout.pdf |
Week 2 Day 3: Spinner Wheel Continued
Overview
During this lesson, the students will be using an online spinner simulation (http://www.shodor.org/interactivate/activities/AdjustableSpinner/) to continue to the exploration of the relationship between area and probability and to introduce the Law of Large Numbers.
The teacher will begin the lesson by administering a bell ringer which covers the material from last lesson (see formativeassessment-spinner.pdf). After the bell ringer is completed, a 10 minute discussion period to review the bell ringer will provide the students a review of past material and the opportunity to reflect on their understanding and completion of the bell ringer. The discussion can be done via an interactive oral discussion, polling via an online voting system, white board discussion, etc.
After the discussion, the teacher will direct the students (in their groups) to visit the spinner simulation via a class set of tablets or laptops and give the students a handout (see lawoflargenumbers.pdf). Then, the students will investigate the Law of Large Numbers by the simulation and the difference between experimental and theoretical probability with aide from the teacher when necessary. If there is enough time, the teacher may also introduce “Gambler’s Fallacy” to coincide with the Law of Large Numbers.
Objectives
Students will be able to:
Alignment with Texas Essential Knowledge and Skills
Geometry TEKS
(1) Mathematical process standards. The student uses mathematical processes to acquire and demonstrate mathematical understanding. The student is expected to:
Statistics TEKS
(5) Probability and random variables. The student applies the mathematical process standards to connect probability and statistics. The student is expected to:
During this lesson, the students will be using an online spinner simulation (http://www.shodor.org/interactivate/activities/AdjustableSpinner/) to continue to the exploration of the relationship between area and probability and to introduce the Law of Large Numbers.
The teacher will begin the lesson by administering a bell ringer which covers the material from last lesson (see formativeassessment-spinner.pdf). After the bell ringer is completed, a 10 minute discussion period to review the bell ringer will provide the students a review of past material and the opportunity to reflect on their understanding and completion of the bell ringer. The discussion can be done via an interactive oral discussion, polling via an online voting system, white board discussion, etc.
After the discussion, the teacher will direct the students (in their groups) to visit the spinner simulation via a class set of tablets or laptops and give the students a handout (see lawoflargenumbers.pdf). Then, the students will investigate the Law of Large Numbers by the simulation and the difference between experimental and theoretical probability with aide from the teacher when necessary. If there is enough time, the teacher may also introduce “Gambler’s Fallacy” to coincide with the Law of Large Numbers.
Objectives
Students will be able to:
- Explain the difference between theoretical and empirical probability
- Use the Law of Large Numbers to describe the relationship between theoretical and empirical probabilities
- Apply the proportional relationship between the measure of the area of a sector of a circle and the area of a circle to solve problems
- Justify the mathematical concept of probability based on area with evidence
Alignment with Texas Essential Knowledge and Skills
Geometry TEKS
(1) Mathematical process standards. The student uses mathematical processes to acquire and demonstrate mathematical understanding. The student is expected to:
- (C) select tools, including real objects, manipulatives, paper and pencil, and technology as appropriate, and techniques, including mental math, estimation, and number sense as appropriate, to solve problems;
- (D) communicate mathematical ideas, reasoning, and their implications using multiple representations, including symbols, diagrams, graphs, and language as appropriate;
- (E) create and use representations to organize, record, and communicate mathematical ideas;
- (F) analyze mathematical relationships to connect and communicate mathematical ideas; and
- (G) display, explain, and justify mathematical ideas and arguments using precise mathematical language in written or oral communication.
- (C) apply the proportional relationship between the measure of the area of a sector of a circle and the area of the circle to solve problems;
- (B) determine probabilities based on area to solve contextual problems;
Statistics TEKS
(5) Probability and random variables. The student applies the mathematical process standards to connect probability and statistics. The student is expected to:
- (B) describe the relationship between theoretical and empirical probabilities using the Law of Large Numbers;
| lawoflargenumbers.pdf |
Week 2 Day 4: Interactive Lecture Benchmark
Overview
Time: One 50-minute lesson
During this lesson, the teacher will facilitate an interactive lecture with the students to discuss the implications of probability in the “Hunger Games” series and Game Theory in “The Dark Knight”. The purpose of the interactive lecture is to formulate critical thinking skills and to introduce new ideas and topics to students for their family game they are designing.
The teacher will launch the students into the discussion of “What are your Chances?” by leading students to discover how probability and interdependent events affects the “Hunger Games”. To begin the discussion, the teacher will summarize the overall premise of the “Hunger Games” and then read a short excerpt from the book, beginning on page 13, which describes the reaping process. The teacher will then have the students do a think-pair-share on the events which affect the probability of having your name drawn from the lottery to become a tribute. The teacher will then have the students share their responses and discuss the interdependence of events and risk/reward system of withdrawing tesserae from the government. The students can then discuss instances where a similar system can be found in a family game or how they might implement a similar system into their family game.
After the “Hunger Games” discussion with students, the teacher will then describe a sinister scenario from the “The Dark Knight” where the Joker gives the following choice to the passengers of two ferries: they can either blow up the other boat and save themselves, or themselves be blow up. If no one decides within a certain amount of time, both ferries are destroyed. The problem that arises in “The Dark Knight” is a classic variation of the prisoner’s dilemma (The prisoner’s dilemma will be explored in more detail later in the unit). Have the students vote anonymously via an electronic poll (a free poll can be created at https://www.polleverywhere.com) as the passengers the Joker has given a choice to (as an added bonus, surprise the students with the poll and give them a time limit to decided just as the Joker had). After the poll, have the students discuss in another think-pair-share the implications of their decisions. Are there optimal strategies? The teacher will then have the students discuss instances where a similar system can be found in a family game or how they might implement a similar system into their family game.
Objectives
Students will be able to:
Alignment with Texas Essential Knowledge and Skills (TEKS)
Geometry TEKS
(1) Mathematical process standards. The student uses mathematical processes to acquire and demonstrate mathematical understanding. The student is expected to:
Advanced Quantitative Reasoning TEKS
(4) Probabilistic and statistical reasoning. The student uses the process standards in mathematics to generate new understandings of probability and statistics. The student analyzes statistical information and evaluates risk and return to connect mathematical ideas and make informed decisions. The student applies a problem-solving model and statistical methods to design and conduct a study that addresses one or more particular question(s). The student uses multiple representations to communicate effectively the results of student-generated statistical studies and the critical analysis of published statistical studies. The student is expected to:
(6) Game (or competition) theory. The student uses knowledge of basic game theory concepts to calculate optimal strategies. The student analyzes situations and identifies the use of gaming strategies. The student is expected to:
Time: One 50-minute lesson
During this lesson, the teacher will facilitate an interactive lecture with the students to discuss the implications of probability in the “Hunger Games” series and Game Theory in “The Dark Knight”. The purpose of the interactive lecture is to formulate critical thinking skills and to introduce new ideas and topics to students for their family game they are designing.
The teacher will launch the students into the discussion of “What are your Chances?” by leading students to discover how probability and interdependent events affects the “Hunger Games”. To begin the discussion, the teacher will summarize the overall premise of the “Hunger Games” and then read a short excerpt from the book, beginning on page 13, which describes the reaping process. The teacher will then have the students do a think-pair-share on the events which affect the probability of having your name drawn from the lottery to become a tribute. The teacher will then have the students share their responses and discuss the interdependence of events and risk/reward system of withdrawing tesserae from the government. The students can then discuss instances where a similar system can be found in a family game or how they might implement a similar system into their family game.
After the “Hunger Games” discussion with students, the teacher will then describe a sinister scenario from the “The Dark Knight” where the Joker gives the following choice to the passengers of two ferries: they can either blow up the other boat and save themselves, or themselves be blow up. If no one decides within a certain amount of time, both ferries are destroyed. The problem that arises in “The Dark Knight” is a classic variation of the prisoner’s dilemma (The prisoner’s dilemma will be explored in more detail later in the unit). Have the students vote anonymously via an electronic poll (a free poll can be created at https://www.polleverywhere.com) as the passengers the Joker has given a choice to (as an added bonus, surprise the students with the poll and give them a time limit to decided just as the Joker had). After the poll, have the students discuss in another think-pair-share the implications of their decisions. Are there optimal strategies? The teacher will then have the students discuss instances where a similar system can be found in a family game or how they might implement a similar system into their family game.
Objectives
Students will be able to:
- Determine whether an event is independent or not
- Explain the concept of interdependent decision making or game theory and identify it in everyday life
- Use critical thinking skills to argue for an optimal strategy
- Use probabilities to justify decisions about risk
- Communicate arguments using precise mathematical language via oral communication or written communication
Alignment with Texas Essential Knowledge and Skills (TEKS)
Geometry TEKS
(1) Mathematical process standards. The student uses mathematical processes to acquire and demonstrate mathematical understanding. The student is expected to:
- (B) use a problem-solving model that incorporates analyzing given information, formulating a plan or strategy, determining a solution, justifying the solution, and evaluating the problem-solving process and the reasonableness of the solution;
- (C) select tools, including real objects, manipulatives, paper and pencil, and technology as appropriate, and techniques, including mental math, estimation, and number sense as appropriate, to solve problems;
- (D) communicate mathematical ideas, reasoning, and their implications using multiple representations, including symbols, diagrams, graphs, and language as appropriate;
- (G) display, explain, and justify mathematical ideas and arguments using precise mathematical language in written or oral communication.
Advanced Quantitative Reasoning TEKS
(4) Probabilistic and statistical reasoning. The student uses the process standards in mathematics to generate new understandings of probability and statistics. The student analyzes statistical information and evaluates risk and return to connect mathematical ideas and make informed decisions. The student applies a problem-solving model and statistical methods to design and conduct a study that addresses one or more particular question(s). The student uses multiple representations to communicate effectively the results of student-generated statistical studies and the critical analysis of published statistical studies. The student is expected to:
- (E) use probabilities to make and justify decisions about risks in everyday life;
- (F) calculate expected value to analyze mathematical fairness, payoff, and risk;
(6) Game (or competition) theory. The student uses knowledge of basic game theory concepts to calculate optimal strategies. The student analyzes situations and identifies the use of gaming strategies. The student is expected to:
- (C) identify basic game theory concepts and vocabulary;
- (E) explain the concept of and need for a mixed strategy;
- (H) identify the nature and implications of the game called "Prisoner's' Dilemma";
- (J) identify examples that illustrate the prevalence of Prisoner's' Dilemma and chicken in our society; and
Week 2 Day 5: Work Day
Time: One 50-minute class day
During this day, Milestone 2 will be due at the beginning of the class period. Students will use the first half of the class to peer review each other's work on the week's milestone and then use the second half of the class to begin work on next week's milestone that is due.
During this day, Milestone 2 will be due at the beginning of the class period. Students will use the first half of the class to peer review each other's work on the week's milestone and then use the second half of the class to begin work on next week's milestone that is due.
| milestone2.pdf |
Week 3 Days 1-2: Monty Hall Problem Investigation
Overview
Time: Two 50-minute lessons
In this lesson, student will be introduced to the concept of game theory by playing the Monty Hall problem and determining the optimal strategy of the conundrum. The lesson will begin with the instructor showing students a clip from the 1960s game show “Let’s Make a Deal”, which includes a mini game where contestants are shown three doors, one of which has a brand new car behind it, while the other two merely have goats. The contestant selects a door, and one of the doors (that the contestant didn’t pick) with the goat behind it is revealed. The contestant is given the opportunity to switch to the other unrevealed door or stay with their initial door choice, and then it is revealed whether they won a goat or a car.
After the student have learned the rules of the game, they are then posed with this driving question: “Which strategy is more likely to result in you getting the car; always switching doors, or always staying with your initial choice?”. To answer this driving question, students will break into groups of two and begin to play their own scaled-down version of the Monty Hall problem, using cups and marbles instead of cars and goats. Each group will be assigned to be the “always switch” group or the “always stay” group.
One student in each group will play the host and place the marble under one cup and mix the cups around. The other student will be the data recorder as well as the initial cup chooser, and record whether each trial results in a success (the selected cup in the end has a marble), or a failure (the selected cup in the end does not have a marble). After a period of repeating trials and data recording, the group assignments will switch; every “always switch” group will become an “always stay” group and vice versa. Additionally, each group will switch roles within them; every host will become a data recorder and vice versa. After the data collection period is done, each group should have a full data table (included in the investigation handout).
All the groups will pool their data together into a class data set, and then these raw numbers will be converted to percentages, to determine the overall rate of success for each strategy, which we will use to answer our driving question.
Because the driving question and methods are teacher-generated, but the answer to the question is student-generated, then this inquiry counts as Level 2 Inquiry.
Objectives
Students will be able to:
Alignment with Texas Essential Knowledge and Skills (TEKS)
Discrete Mathematics TEKS
(6) Game (or competition) theory. The student uses knowledge of basic game theory concepts to calculate optimal strategies. The student analyzes situations and identifies the use of gaming strategies. The student is expected to:
Time: Two 50-minute lessons
In this lesson, student will be introduced to the concept of game theory by playing the Monty Hall problem and determining the optimal strategy of the conundrum. The lesson will begin with the instructor showing students a clip from the 1960s game show “Let’s Make a Deal”, which includes a mini game where contestants are shown three doors, one of which has a brand new car behind it, while the other two merely have goats. The contestant selects a door, and one of the doors (that the contestant didn’t pick) with the goat behind it is revealed. The contestant is given the opportunity to switch to the other unrevealed door or stay with their initial door choice, and then it is revealed whether they won a goat or a car.
After the student have learned the rules of the game, they are then posed with this driving question: “Which strategy is more likely to result in you getting the car; always switching doors, or always staying with your initial choice?”. To answer this driving question, students will break into groups of two and begin to play their own scaled-down version of the Monty Hall problem, using cups and marbles instead of cars and goats. Each group will be assigned to be the “always switch” group or the “always stay” group.
One student in each group will play the host and place the marble under one cup and mix the cups around. The other student will be the data recorder as well as the initial cup chooser, and record whether each trial results in a success (the selected cup in the end has a marble), or a failure (the selected cup in the end does not have a marble). After a period of repeating trials and data recording, the group assignments will switch; every “always switch” group will become an “always stay” group and vice versa. Additionally, each group will switch roles within them; every host will become a data recorder and vice versa. After the data collection period is done, each group should have a full data table (included in the investigation handout).
All the groups will pool their data together into a class data set, and then these raw numbers will be converted to percentages, to determine the overall rate of success for each strategy, which we will use to answer our driving question.
Because the driving question and methods are teacher-generated, but the answer to the question is student-generated, then this inquiry counts as Level 2 Inquiry.
Objectives
Students will be able to:
- Identify the Monty Hall problem
- Record success/failure data from multiple trials of the Monty Hall problem
- Use their recorded data to determine an optimal strategy for the Monty Hall problem.
Alignment with Texas Essential Knowledge and Skills (TEKS)
Discrete Mathematics TEKS
(6) Game (or competition) theory. The student uses knowledge of basic game theory concepts to calculate optimal strategies. The student analyzes situations and identifies the use of gaming strategies. The student is expected to:
- (A) recognize competitive game situations;
- (C) identify basic game theory concepts and vocabulary;
- (E) explain the concept of and need for a mixed strategy;
- (F) compute the optimal mixed strategy and the expected value for a player in a game who has only two pure strategies;
| montyhallinvestigationhandout.pdf |
Week 3 Days 3-4: Game Theory Benchmark
Overview
Time: Two 50-minute lessons
In this lesson students will learn about game theory and three famous applications of the theory in real life. Students will be given handouts (included with this lesson overview) with contingency tables on it and scenarios based on examples of game theory.
The instructor will explain the scenarios for each table as follows (via handout and verbal instructions): For “Prisoner’s Dilemma”, there are two prisoners accused of a major crime that the prosecutors can’t convict them of with the evidence they had. To get one of them to confess, the prosecutors isolate the two prisoners and tell them they have evidence to convict them of a lesser charge, but they’ll drop it and the major charge if they confess and implicate the other prisoner in the major crime. The choices the prisoners could make are to remain silent or confess.
For “Chicken”, there are two people on motorcycles riding directly towards each other at high speeds. The choices the riders could make are that they can continue riding forward in the direction they’re going, or they can swerve to the side to avoid the other rider (but they’ll be admitting they’re a “chicken”).
For “Hawk-Dove Model”, two animals of the same species are in an aggressive encounter. The choices the animals could make are to be a “hawk” (being aggressive and confrontational) or to be a “dove” (being pacifistic and non-confrontational).
After each scenario is presented, students will have time to discuss in groups what the outcome of each choice made in the scenario, how the two choices will interact, and what the benefits and costs of each outcome for each participant will be. Students will be encouraged to represent each outcome as a mathematical expression using variables to represent costs and benefits (for example JM could stand for the amount of jail time one of the prisoners will serve for the major crime, while JL could stand for the amount of jails time served for the lesser charge). After the group deliberation, the class will come together and discuss what they wrote down, while the instructor consolidates their ideas on a class set of the handout (on a whiteboard or projector).
Once all three scenarios have been discussed, the students will be asked if there is any one optimal strategy for any of the scenarios given, and if so, why or why not.
Objectives
Students will be able to:
Alignment with Texas Essential Knowledge and Skills
Discrete Mathematics
(6) Game (or competition) theory. The student uses knowledge of basic game theory concepts to calculate optimal strategies. The student analyzes situations and identifies the use of gaming strategies. The student is expected to:
Biology TEKS
(12) Science concepts. The student knows that interdependence and interactions occur within an environmental system. The student is expected to:
Time: Two 50-minute lessons
In this lesson students will learn about game theory and three famous applications of the theory in real life. Students will be given handouts (included with this lesson overview) with contingency tables on it and scenarios based on examples of game theory.
The instructor will explain the scenarios for each table as follows (via handout and verbal instructions): For “Prisoner’s Dilemma”, there are two prisoners accused of a major crime that the prosecutors can’t convict them of with the evidence they had. To get one of them to confess, the prosecutors isolate the two prisoners and tell them they have evidence to convict them of a lesser charge, but they’ll drop it and the major charge if they confess and implicate the other prisoner in the major crime. The choices the prisoners could make are to remain silent or confess.
For “Chicken”, there are two people on motorcycles riding directly towards each other at high speeds. The choices the riders could make are that they can continue riding forward in the direction they’re going, or they can swerve to the side to avoid the other rider (but they’ll be admitting they’re a “chicken”).
For “Hawk-Dove Model”, two animals of the same species are in an aggressive encounter. The choices the animals could make are to be a “hawk” (being aggressive and confrontational) or to be a “dove” (being pacifistic and non-confrontational).
After each scenario is presented, students will have time to discuss in groups what the outcome of each choice made in the scenario, how the two choices will interact, and what the benefits and costs of each outcome for each participant will be. Students will be encouraged to represent each outcome as a mathematical expression using variables to represent costs and benefits (for example JM could stand for the amount of jail time one of the prisoners will serve for the major crime, while JL could stand for the amount of jails time served for the lesser charge). After the group deliberation, the class will come together and discuss what they wrote down, while the instructor consolidates their ideas on a class set of the handout (on a whiteboard or projector).
Once all three scenarios have been discussed, the students will be asked if there is any one optimal strategy for any of the scenarios given, and if so, why or why not.
Objectives
Students will be able to:
- Identify game theory
- Identify examples of game theory in real life
- Predict the outcomes of choices in game theory on a contingency table
- Affirm that not all choices have a single optimal strategy
Alignment with Texas Essential Knowledge and Skills
Discrete Mathematics
(6) Game (or competition) theory. The student uses knowledge of basic game theory concepts to calculate optimal strategies. The student analyzes situations and identifies the use of gaming strategies. The student is expected to:
- (A) recognize competitive game situations;
- (C) identify basic game theory concepts and vocabulary;
- (E) explain the concept of and need for a mixed strategy;
- (F) compute the optimal mixed strategy and the expected value for a player in a game who has
- only two pure strategies;
- (H) identify the nature and implications of the game called "Prisoner's' Dilemma";
- (I) explain the game known as "chicken";
- (J) identify examples that illustrate the prevalence of Prisoner's' Dilemma and chicken in our society
Biology TEKS
(12) Science concepts. The student knows that interdependence and interactions occur within an environmental system. The student is expected to:
- (A) interpret relationships, including predation, parasitism, commensalism, mutualism, and competition among organisms;
- (B) compare variations and adaptations of organisms in different ecosystems;
| gametheoryhandout.pdf |
| gametheoryscenarioshandout.pdf |
Week 3 Day 5: Work Day
Time: One 50-minute class day
During this day, Milestone 3 will be due at the beginning of the class period. Students will use the first half of the class to peer review each other's work on the week's milestone and then use the second half of the class to begin work on next week's milestone that is due.
During this day, Milestone 3 will be due at the beginning of the class period. Students will use the first half of the class to peer review each other's work on the week's milestone and then use the second half of the class to begin work on next week's milestone that is due.
| milestone3.pdf |
Week 4 Day 1: Experimental Design Benchmark
Overview
Students will learn about the 3 types of experimental design: observational studies, surveys, and experiments through the learning cycle approach. Each team will be given a class set of experiment cards (see experimentcards.pdf), a whiteboard, and a whiteboard marker. Students will read the cards and group them into different categories on the whiteboard. The teacher will call on one group to bring their whiteboard to the doc cam. The group will explain the categories they chose and why they put each card in its category. The teacher will ask if any group did the same thing. If not, what did they do differently? This will lead into a discussion in which students can explain why they chose certain categories or about a specific journal type. Afterwards, the teacher will explain the different types of experimental design. Then the class altogether will fill in a chart on the board of the definition, results, pros, and cons for each type of experimental design.
Objectives
Students will be able to:
Alignment with Texas Essential Knowledge and Skills
Statistics TEKS
(2) Statistical process sampling and experimentation. The student applies mathematical processes to apply understandings about statistical studies, surveys, and experiments to design and conduct a study and use graphical, numerical, and analytical techniques to communicate the results of the study. The student is expected to:
Students will learn about the 3 types of experimental design: observational studies, surveys, and experiments through the learning cycle approach. Each team will be given a class set of experiment cards (see experimentcards.pdf), a whiteboard, and a whiteboard marker. Students will read the cards and group them into different categories on the whiteboard. The teacher will call on one group to bring their whiteboard to the doc cam. The group will explain the categories they chose and why they put each card in its category. The teacher will ask if any group did the same thing. If not, what did they do differently? This will lead into a discussion in which students can explain why they chose certain categories or about a specific journal type. Afterwards, the teacher will explain the different types of experimental design. Then the class altogether will fill in a chart on the board of the definition, results, pros, and cons for each type of experimental design.
Objectives
Students will be able to:
- Distinguish between observational studies, surveys, and experiments
- Design an experiment to test their game
Alignment with Texas Essential Knowledge and Skills
Statistics TEKS
(2) Statistical process sampling and experimentation. The student applies mathematical processes to apply understandings about statistical studies, surveys, and experiments to design and conduct a study and use graphical, numerical, and analytical techniques to communicate the results of the study. The student is expected to:
- (B) distinguish among observational studies, surveys, and experiments;
- (C) analyze generalizations made from observational studies, surveys, and experiments;
- (E) formulate a meaningful question, determine the data needed to answer the question, gather the appropriate data, analyze the data, and draw reasonable conclusions;
| experimentcards.pdf |
Week 4 Day 2: Sampling Benchmark
Overview
During this lesson students will learn about randomness and the different sampling techniques through an interactive lecture. As students are walking into the classroom there will be a link/QR code on the board to a Google form with one question: Choose a random number between 1 and 4. Once all students have entered a number, the teacher will create a histogram of results. Before displaying, the teacher will ask students to do a think-pair-share on how many students chose each number between 1 and 4. Then display the results. Most students will choose 2 or 3. Ask why there is not an equal amount of each number. The teacher will explain the definition of random. Then the teacher will ask students in their groups to come up with different methods of selecting 5 students from the class randomly. After discussion, the teacher will share how to use a random number table to select 5 students randomly from the class. The teacher will explain that this is called random sampling. Then the teacher will pass out this picture of “Guess Who?” characters.
During this lesson students will learn about randomness and the different sampling techniques through an interactive lecture. As students are walking into the classroom there will be a link/QR code on the board to a Google form with one question: Choose a random number between 1 and 4. Once all students have entered a number, the teacher will create a histogram of results. Before displaying, the teacher will ask students to do a think-pair-share on how many students chose each number between 1 and 4. Then display the results. Most students will choose 2 or 3. Ask why there is not an equal amount of each number. The teacher will explain the definition of random. Then the teacher will ask students in their groups to come up with different methods of selecting 5 students from the class randomly. After discussion, the teacher will share how to use a random number table to select 5 students randomly from the class. The teacher will explain that this is called random sampling. Then the teacher will pass out this picture of “Guess Who?” characters.
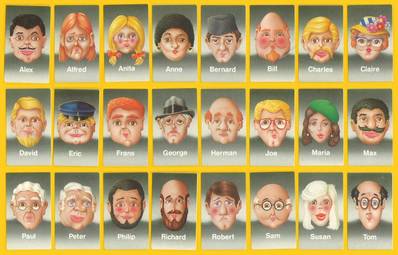
Using this picture, the teacher will explain different convenience sampling techniques while asking students to follow along on the handout (ex: circle every 5th person for systematic sampling). End with a discussion on why random sampling is important and the benefits of each sampling method.
Objectives
Students will be able to:
Statistics TEKS
(2) Statistical process sampling and experimentation. The student applies mathematical processes to apply understandings about statistical studies, surveys, and experiments to design and conduct a study and use graphical, numerical, and analytical techniques to communicate the results of the study. The student is expected to:
Objectives
Students will be able to:
- Define what it means to be random and use a random number table
- Describe the different sampling techniques
Statistics TEKS
(2) Statistical process sampling and experimentation. The student applies mathematical processes to apply understandings about statistical studies, surveys, and experiments to design and conduct a study and use graphical, numerical, and analytical techniques to communicate the results of the study. The student is expected to:
- (A) compare and contrast the benefits of different sampling techniques, including random sampling and convenience sampling methods;
| guesswho.pdf |
Week 4 Day 4: Work Day
Time: One 50-minute class day
During this day, Milestone 4 will be due at the beginning of the class period. Students will use the first half of the class to peer review each other's work on the week's milestone and then use the second half of the class toward completing their project.
During this day, Milestone 4 will be due at the beginning of the class period. Students will use the first half of the class to peer review each other's work on the week's milestone and then use the second half of the class toward completing their project.
| milestone4.pdf |
References
Bell, R., Smetana, L., & Binns, I. (2005). Simplifying Inquiry Instruction: Assessing the Inquiry Level of Classroom Activities. The Science Teacher.
Burleson Consulting. "Deal or No Deal Probabilities." Deal or No Deal Probabilities. Oracle Corporation, n.d. Web. 14 Dec. 2015. <http://www.dba-oracle.com/fun_deal_or_no_deal.htm>
DeRosa, Tom. "I Want to Teach Forever." Lesson Idea: Probability Using Deal or No Deal. Awesome Inc., 09 Feb. 2008. Web. 14 Dec. 2015. <http://www.teachforever.com/2008/02/lesson-idea-probability-using-deal-or.html>
Gillis, V., & MacDougall, G. (2007). Reading to Learn Science as an Active Process: Using Learning Cycles in the Classroom Can Actively Engage Students in Thinking, Talking, Reading, and Writing about Science. The Science Teacher.
National Research Council (NRC). (1996). National Science Education Standards. Washington, DC: National Academy Press.
National Research Council (NRC). (2000). Inquiry and the National Science Education Standards: A Guide for Teaching and Learning. Washington, D.C.: National Academy Press.
